Fee and Registration info
Conference fee
- Early fee: 1265 euro, when you register before May 15st, 2017.
- Regular fee: 1415 euro, when you register from May 15st, 2017.
- Student early fee: 990 euro, when you register before May 15st 2017.
- Student regular fee: 1100 euro, when you register from May 15st, 2017.
The registration fee covers:
- Welcome reception.
- Hotel booking (4 nights).
- Breakfast, lunch, dinner, refreshments.
- Admission to all sessions / exhibitions / conference courses
- Conference materials.
- Conference dinner.
- Excursion / social event.
It is not possible to register for only a part of the conference.
Registration
Click HERE to start the registration procedure for ICRM2017.
Cancellations
Substitutions may be made at any time, but please advise the conference secretariat of a change of name. If you find it necessary to cancel the registration completely, please notify the symposium secretariat immediately. Provided written notice is received by May 20th 2017, a full refund will be given minus a 10% administration charge. Provided written notice is received by July 1st 2017, a 50% refund will be given. Registrations cancelled after July 1st 2017 and no-shows remain payable at full charges.
ICRM2017 Contact
You can contact us by email at
Keynote lecturers
- Peter Wentzell (Dalhousie University, Halifax, Canada) - On the Rise, Demise, and Reprise of Chemometric Tools: Some Case Studies
- Lieven De Lathauwer (KU Leuven, Belgium) - Structure in matrix/tensor decompositions
- Peter Filzmoser (TU Wien, Austria) - PLS for regression and binary classification: robustness and sparsity
- Morten Rasmussen (University of Copenhagen, Denmark) - Microbiome: Challenges and Opportunities
- Marieke Timmerman (RU Groningen, The Netherlands) - Additive and bilinear models to unravel multivariate experimental design effects
- Onno de Noord (Shell Amsterdam, The Netherlands) - Chemometrics in industry: a 360° view
- Edwin Lughofer (Johannes Kepler University Linz, Austria) - Evolving Chemometric Models: A New Paradigm for Handling Dynamic (Stream-based) Calibration in Chemical Industry
Program and abstracts Chemometrics Symposium 2016 available
The program and abstracts of the Chemometrics Symposium 2016 in Ravenstein is available now. Please be aware that you receive a printed copy of this program booklet when you attend the symposium.
Abstracts Chemometrics Symposium 2016
The abstracts of the presentations that will be given on our Chemometrics Symposium 2016 can be found via this link:
Launch new DCS website
On September 9th 2016 the Dutch Chemometrics Society launched its new website. This up-to-date, smartphone aware website runs in Joomla and was designed in cooperation with Stip in Driebergen, The Netherlands.
Abstracts presentations Chemometrics Symposium 2016
Rudolf Kessler
“Perspectives in Process Analysis: Remarks on Robustness of Spectroscopic Methods for Industrial Applications".
Prof. Dr. Rudolf W. Kessler
Steinbeis Technology Transfer Centre Process Control and Data Analysis,
Kaiserstr. 66, 72764 Reutlingen, Germany
Reutlingen University, Process Analysis & Technology, PA&T,
contact:
Intelligent manufacturing has attracted enormous interest in recent years, not least because of the Process Analytical Technology/Quality by Design platform of the FDA and now also by the initiative Industrie 4.0. The future of industrial automation will be “arbitrarily modifiable and expandable (flexible), connect arbitrary components of multiple producers (networked), enabling its components to perform tasks related to its context independently (self-organizational) and emphasizes ease of use (user-oriented)”. Optical spectroscopy will play a major role in the sensor technology as it provides simultaneously chemical and morphological information [1].
The sensitivity of an analyte can be described by the quantum mechanical cross sections of the molecule which are the effective area that governs the probability of an event of e.g. elastic scattering, or absorption, or emission (e.g. fluorescence or Raman) of a photon at a specified wavelength. Another very important criterion for an analytical method is its capability to deliver signals that are free from interferences and give “true results” and is called selectivity resp. specificity. The responses are based on interactions usually evaluated in a mathematical domain by e.g. chemometrics, giving what has been called “computational selectivity”. Besides these key elements, many other aspects must also be taken into account to ensure robustness of the inline measurement [2].
The paper will discuss the advantages and disadvantages of the spectroscopic inline techniques. Examples demonstrate robust optical set ups in different industrial applications, e.g. biotechnology, pharmacy and manufacturing industry. It illustrates the opportunity to receive robust spectroscopic information with causal relations to the target value. It is important to emphasize, that inline quality control by spectroscopic techniques is a holistic approach. Process chemists, process engineers, chemometricians, and many other technologists must work together where multimodality will be a bedrock supporting the production of smart materials in smart factories.
[1] R. W. Kessler, Perspectives in Process Analysis. J. Chemometrics, 2013, 27: 369–378. doi: 10.1002/cem.2549
[2] R. W. Kessler, W. Kessler and E. Zikulnig-Rusch, A Critical Summary of Spectroscopic Techniques and their Robustness in Industrial PAT Applications, Chem. Ing. Tech. 2016, 88, No. 6, 710–721
Jan Gerretzen
“A novel and effective way for preprocessing selection based on Design of Experiments”.
Jan Gerretzen1,2,3, Ewa Szymańska1,2, Jacob Bart3, Tony Davies3, Henk-Jan van Manen3, Edwin van den Heuvel4, Jeroen Jansen1 and Lutgarde Buydens1
1Radboud University, Institute for Molecules and Materials, Heyendaalseweg 135, 6525 AJ Nijmegen, The Netherlands
2TI-COAST, Science Park 904, 1098 XH Amsterdam, The Netherlands
3AkzoNobel, Supply Chain, Research & Development, Zutphenseweg 10, 7418 AJ Deventer, The Netherlands
4Eindhoven University of Technology, Groene Loper 5, 5600 RM Eindhoven, The Netherlands
The aim of data preprocessing is to remove data artifacts—such as a baseline, scatter effects or noise—from the data and to enhance the analytically relevant information. Many preprocessing methods exist to do either or both, but it is not at all clear on beforehand which preprocessing methods should optimally be used. Appropriate preprocessing selection is a very important aspect in data analysis, since we have shown that multivariate model performance is often heavily influenced by preprocessing [1].
Current preprocessing selection approaches, however, are time consuming and/or based on arbitrary choices that do not necessarily improve the model [1]. It is thus highly desired to come up with a novel, generic preprocessing selection procedure that leads to a proper preprocessing within reasonable time. In this presentation, a novel and simple preprocessing selection approach will be presented, based on Design of Experiments (DoE) and Partial Least Squares (PLS) [2]. It will be shown that preprocessing selected using this approach improves both improves model performance and model interpretability. The latter will be illustrated using variable selection. The focus of the presentation will be on spectroscopic data.
This work is part of the ‘Analysis of Large data sets By Enhanced Robust Techniques’ project (ALBERT), funded by TI-COAST, which aims to develop generic strategies and methods to facilitate better and more robust chemometric and statistical analyses of complex analytical data.
Acknowledgement: This research received funding from the Netherlands Organization for Scientific Research (NWO) in the framework of Technology Area COAST.
References:
[1] J. Engel, et al. Trends in Anal. Chem., 50, 96 (2013)
[2] J. Gerretzen, et al., Anal. Chem., 87, 12096 (2015)
Andrei Barcaru
“Thinking Bayes: creating new ways of interpreting GCxGC(-MS) data”.
Nowadays, Bayesian statistics becomes increasingly popular in application fields as diverse as psychometrics, geophysics, sociology, medicine and (last but not least) analytical chemistry. The objectivity and robustness of Bayesian analysis made it an important tool in the WW II. Nowadays it has become the mathematical representation of how our brain works [1].
In the CHROMAMETRICS project, we used Bayesian statistics to create powerful and robust algorithms for data processing originated by chromatographic and mass spectrometry instrumentation. Some useful applications developed within the CHROMAMETRICS project based on Bayesian paradigm are going to be discussed in this communication. For example, Bayesian statistics has been applied to peak tracking in two-dimensional gas chromatography. Peak tracking refers to the matching of two peak tables. When a sample is analyzed in two different conditions (different inlet pressure and/or temperature program), the goal is to match the compounds from one chromatogram with those in the other. [2] The application of Bayesian analysis to this problem results in a paradigm shift compared to the way traditional peak matching algorithms work. Instead of a single (deterministic) answer, a collection of answers about possible peak matching results is achieved, with a probability assigned for each peak assignation. Another example is the comparison of two samples analyzed in GCxGC-MS, to find meaningful differences among them. In this case, the objective is to find compounds that are present in one sample but absent in the other. The application of Jensen-Shannon divergence within a Bayesian framework proved to give meaningful results, as well as robust against peak misalignments. [3]
In this communication, emphasis is given in the paradigm shift that using Bayesian analysis supposes, against traditional data analysis methods. Moreover, the methods developed in this project integrate different tools from different fields such as information technology and image analysis within the Bayesian framework.
[1] S. B. McGrayne, The Theory That Would Not Die: How Bayes’ Rule Cracked the Enigma Code, Hunted Down Russian Submarines, and Emerged Triumphant from Two Centuries of Controversy., Yale University Press, 2011.
[2] A. Barcaru, E. Derks and G. Vivó-Truyols, "Bayesian peak tracking: a novel probabilistic approach to match GCxGC chromatograms," Anal. Chim. Acta, 2016.
[3] A. Barcaru and G. Vivó-Truyols, "Use of Bayesian Statistics for Pairwise Comparison of Megavariate Data Sets: Extracting Meaningful Differences between GCxGC-MS Chromatograms Using Jensen–Shannon Divergence," Anal. Chem., no. 88 (4), p. 2096–2104, 2016.
Cyril Ruckebusch
“Chemometric analysis of chemical images ”.
Cyril Ruckebusch, Université de Lille, LASIR CNRS UMR 8516, F-59000 Lille, France
Chemical imaging aims to create a visual image of the different chemical compounds in a sample. This can be achieved by simultaneous measurement of spatial, spectral and/or temporal information. Image processing is required to obtain information regarding the mapping or distribution of these compounds in a biological or chemical image. In this talk, we will present our recent efforts to process hyperspectral images and super-resolution wide-field fluorescence nanoscopy data. We will show how the results obtained can be relevant to analyze other types of imaging modalities.
Olga Lushchikova
“Development of alarm system for water quality control based on flow cytometry data of algal populations”.
Olga Lushchikovaab, Gerjen Tinneveltab, Arnold Veenc, Jeroen Jansenb
aTI-COAST, Science Park 904, 1098 XH Amsterdam, The Netherlands
bRadboud University, Institute for Molecules and Materials, (Analytical Chemistry), P.O. Box 9010, 6500 GL Nijmegen, The Netherlands
cRijkswaterstaat, Zuiderwagenplein 2, 8224 AD Lelystad, The Nederlands
Rijkswaterstaat (RWS) applied flow cytometry for the on-line biomonitoring of algal cells in the river water to perform an accurate and fast water quality control. This biomonitoring is based on the measurement of optical properties of every single cell, that lead to a large amount of data. This is why, we developed a dedicated chemometric method, which is called DAMACY, to analyse the spectroscopic data. DAMACY is a multivariate method, which first describes the measured fingerprints of the algal communities. Secondly, this method predicts the normal environmental conditions such as the water temperature or day length. If the predicted natural factor shows large deviation, the sample can be examined more carefully to find the non-natural cause. Previously the results were obtained using offline methods, such as microscopy. Because of this procedure the monitoring could not be frequent whereupon the small water pollutions were hidden. This warning system will detect specific water pollution events early and robustly.
Ewoud van Velzen
"Robustness: A key parameter in the validation of multivariate sensory regression models”.
E.J.J. van Velzen1, S. Lam2, E. Saccenti2, A.K. Smilde2, E. Tareilus1, J.P.M. van Duynhoven1, D.M. Jacobs1
1Unilever Research, Microbiology & Analytical, Olivier van Noortlaan 120, Vlaardingen, The Netherlands
2Universiteit van Amsterdam, Biosystems Data Analysis, Science Park 904, Amsterdam, The Netherlands
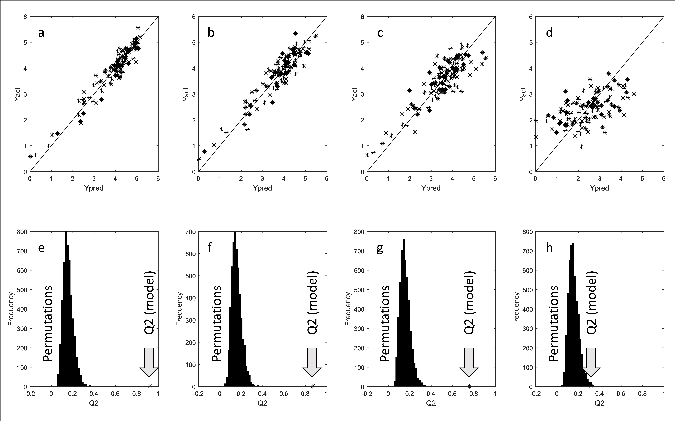
International guidelines define robustness of an analytical procedure as a measure of its capacity to remain unaffected by small variations in experimental conditions [1]. Robustness is generally not considered in validation protocols even though it provides an important indicator of the fitness of an analytical procedure during normal use. Also in the validation of multivariate sensory regression models robustness is seldom included. Particularly in “Sensoromics” analysis, where multivariate relationships are assessed between descriptive (consumer) data and compositional (chemical) data, we state that a measure of robustness is a critical parameter for establishing model reliability and model suitability.
 |
|
Figure 1. Actual versus predicted sensory scores obtained from a statistically significant PLS model (a-d). Increasing levels of artificial noise were added. As a result the statistical significance of the model dropped. This is demonstrated by the Q2-values in a permutation test (e-h). |
We demonstrated the importance of robustness testing in a sensory study in which the chemical compositions of natural food products was associated with the descriptive scores of a trained consumer panel. This multivariate association was modelled by means of PLS. The data was rather complex as (i) the predictor set was compiled of various analytical datasets with different error structures, and (ii) the predictor set contained missing data. Furthermore, the data was sparse given the enormous sample diversity in the training set. By integration of predefined noise simulations in the double cross-validation and the permutation testing [2], estimates of the relevant model statistics (e.g. Q2-values) could be obtained (Figure 1). The aim of this approach is that the susceptibility of the multivariate models against experimental errors can be tested. We found that robustness testing is of great additional value in the validation of multivariate prediction models. An important prerequisite, however, is that the error structures of the dependent and independent variables should be well known in advance.
References:
[1] Y. vander Heyden et al., J Pharm Biomed Anal., 5-6, 723-753 (2001).
[2] J.A. Westerhuis et al., Metabolomics, 4, 1, 81-89 (2008).
Venue
Fletcher Parkhotel Val Monte
Oude Holleweg 5
6572 AA - Berg en Dal / Nijmegen, the Netherlands
Tel: +31 (0)24 684 2000
E-mail:
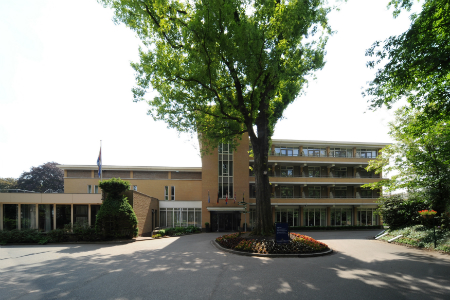
Fletcher Parkhotel Val Monte is located in the area of Berg en Dal only 5 minutes from downtown Nijmegen.
Accessibility by public transport
Arriving at Schiphol airport:
Trains from Schiphol to Nijmegen (Sunday 10th September): 4 times per hour at :01, :16, :31 and :46 (19.60 euro 2nd class). Fletcher Parkhotel Val Monte can be reached from Nijmegen Central Station with a taxi (approximately 20 euro) or by bus. (bus 8 to Berg en Dal, ± 20 min), get off at stop "De Meerberg" and after that ± 200m walk. For information on trains see www.ns.nl/en, for busses and trains look at website www.9292.nl/en.
Arriving at Dusseldorf Weeze airport or Dusseldorf International airport:
By train, find your train connection at www.bahn.de.
Accessibility by car
From the North
Follow highway A50 to Arnhem, then A325 to Nijmegen. Enter Nijmegen and cross the bridge (Waalbrug). Follow the signs 'Berg en Dal'. In Berg en Dal turn left at the 3rd street (Oude Holleweg). You will see the sign Fletcher Parkhotel Val Monte.
From the South
Follow highway A73 to Nijmegen. Follow sign N326 Nijmegen. Follow the street Graafseweg till the roundabout Keizer Karelplein in the centre of Nijmegen. Leave the roundabout at the 2nd street, this is the "Oranjesingel". Follow the signs Berg en Dal and turn right at the 3rd street (Berg en Dalseweg). In Berg en Dal turn left at the 3rd street (Oude Holleweg). You will see the sign Fletcher Parkhotel Val Monte.
From the West
Follow Highway A12 or A15. Don't follow the signs Nijmegen at travel junction Valburg but follow Kleve/Bemmel. Turn right to A325 towards Nijmegen. Enter Nijmegen and cross the bridge (Waalbrug). Follow the signs 'Berg en Dal'. In Berg en Dal turn left at the 3rd street (Oude Holleweg). You will see the sign Fletcher Parkhotel Val Monte.
From the East
Follow N325 (Nieuwe Rijksweg) Kleve-Nijmegen and follow the signs Berg en Dal. Follow signs "Beek". In Beek follow the Rijksstraatweg and take the Oude Holleweg. Follow the signs Fletcher Parkhotel Val Monte.
Other direction
From Schiphol to Utrecht A9 and A2,Utrecht direction Arnhem A12,direction Nijmegen A50, A15 directionKleve-Bemmel, A325 direction Nijmegen.Direction Berg en Dal.
ICRM2017 Organizing and Scientific Committee
Organizing Committee
- Paul Eilers, Erasmus MC, Rotterdam (chair)
- Jeroen Jansen, Radboud University Nijmegen (co-chair)
- Gerben Mooiweer, JDEcoffee/R&D, Utrecht
- Bülent Üstün, Aspen BV, Oss
- Jos Hageman, Biometris, Wageningen University
- Agnieszka Smolinska, Maastricht University
- Jan Gerretzen, AkzoNobel Specialty Chemicals RD&I, Deventer
Scientific Committee
- Lutgarde Buydens, Analytical Chemistry, Institute for Molecules and Materials, Faculty of Sciences, Radboud University
- Age Smilde, Biosystems Data Analysis, Swammerdam Institute for Life Sciences, University of Amsterdam
- Paul Eilers, Department of Biostatistics, Erasmus University Medical Centre, Rotterdam
Archive: ACS 2013
28th Annual Chemometrics Symposium
November 7th, 2013
Jaarbeurs Conference Center, High Five beursvloer,
Jaarbeursplein, Utrecht

This year the 28th Annual Chemometrics Symposium of the Dutch Chemometrics Society on November 7th is part of the The Analytical Challenge conference on analytical chemistry and life sciences and the Labtechnology 2013 fair.
Program with short titles
9.00 Registration, coffee and plenary TAC lecture by Ad Bax.
11.00 Paul Eilers – Opening
11.15 Gianluca Baio –
“Come to the dark side: we got cookies! An introduction to Bayesian statistics”
12.15 Walking lunch / Poster session
13.15 Ron Wehrens – “Stability selection in metabolomics applications”
14.00 Jasper Engel – “Adapting MANOVA for analysis of -omics data”
14.30 Coffee/tea break
14.45 Johan de Rooi – “Sparse (blind) deconvolution with L0-penalties”
15.15 Marjan Sjerps – “Measuring evidential strength of chemical observations”
15.45 Winning Poster Announcement
Language
The official language of the symposium will be English.
Posters
Participants are invited to share their work during the poster session that will take place during the lunch break. A poster prize (100€) will be awarded to the best poster. If you want to submit a poster, send an e-mail before 24th October 2013 with title and abstract to
Venue
The meeting will take place at the Jaarbeurs Conference Center, High Five beursvloer,Jaarbeursplein, Utrecht.
Visiting address:
Jaarbeursplein
3521 AL Utrecht
Telephone: + 31 (0)30 295 5911
Jaarbeurs Conference Center Utrecht is located in the center of Utrecht and is therefore easily accessible using public transport. For train passengers, Utrecht Central Station is right next door. From Central Station, follow the signs ‘Jaarbeursplein’ for the five-minute walk to Jaarbeurs Conference Center Utrecht.
Registration
Registration is required. You register for The Analytical Challenge at web page http://www.theanalyticalchallenge.nl/inschrijven. Registration fee is 50 euro, students pay 15 euro.
Organizing Committee
Paul Eilers, Erasmus MC Rotterdam
Jeroen Jansen, Radboud University Nijmegen
Bülent Üstün, MSD Oss
Margriet Hendriks, University Leiden
Eduard Derks, DSM Geleen
Gerben Mooiweer, Douwe Egberts Utrecht
Archive: ACS 2015
29th Annual Chemometrics Symposium
“How to handle missing and censored data”
Thursday 15th October 2015, Wageningen, The Netherlands

Most recipes for data analysis assume that data are complete and have been measured accurately. In real life this often is not the case. Data can be missing, which means that they have not been measured at all. Or they may be censored, which means that they are known to be less (or sometimes larger) than a given threshold. Both cases need special treatment.
The Dutch Chemometrics Society invites you to their Annual Chemometrics Symposium 2015 that will focus on handling missing and censored data. We are proud to present a program with excellent speakers, who will discuss theory and practical applications.
Speakers with their presentation titles:
• Stef van Buuren
“Multiple imputation of incomplete multivariate data: a bird’s eye view”
• Hae-Won Uh
“Dealing with data below the detection limit: a statistical view on uncertainty”.
• Jeroen Elassaiss-Schaap
“Mixing censoring into population PK and PK-PD nonlinear mixed effects”
• Gerjen Tinnevelt
“A PLS-based approach to combine multiple flow cytometry tubes”.
• Martin Lopatka
“Novel data imputation to emulate complex mixing condition seen in fire debris samples”.
• Jos Hageman
“Batch correction for LCMS in the presence of non-detects”.
Location
The meeting will take place in meeting room C103, Forum, building number 102, Droevendaalsesteeg 2, 6708 PB Wageningen, The Netherlands. See Forum-building-number-102 for a description and how to get there.
Time
Registration and coffee between 9:15 and 9:55, opening symposium at 9:55.
Fee
The registration fee is 100 euros (50 for students and PhD students). Everything is included: participation in the meetings, lunch, refreshments and drinks at the end of the day. It is not possible to register for a half-day at a reduced price.
Language
The official language of the symposium will be English.
Posters
Participants are invited to share their work during the poster session that will take place during the lunch break. A poster prize (100€) will be awarded to the best poster. If you want to submit a poster, send an e-mail before 1st October with title and abstract to
How to register
Reply to this e-mail with your name, address and affiliation or send this information to the Dutch Chemometrics Society e-mail address
On behalf of the organizing committee we are looking forward to meet you in Wageningen,
Paul Eilers, Erasmus MC Rotterdam.
Gerben Mooiweer, JDEcoffee/R&D, Utrecht.
Bülent Üstün, Aspen Oss BV, Oss.
Jeroen Jansen, Radboud Universiteit Nijmegen, Nijmegen.
Jos Hageman, Wageningen University, Wageningen.
Theo Reijmers, Swammerdam Institute for Life Sciences, Amsterdam.